
How to Analyze the Stock Market with Claude
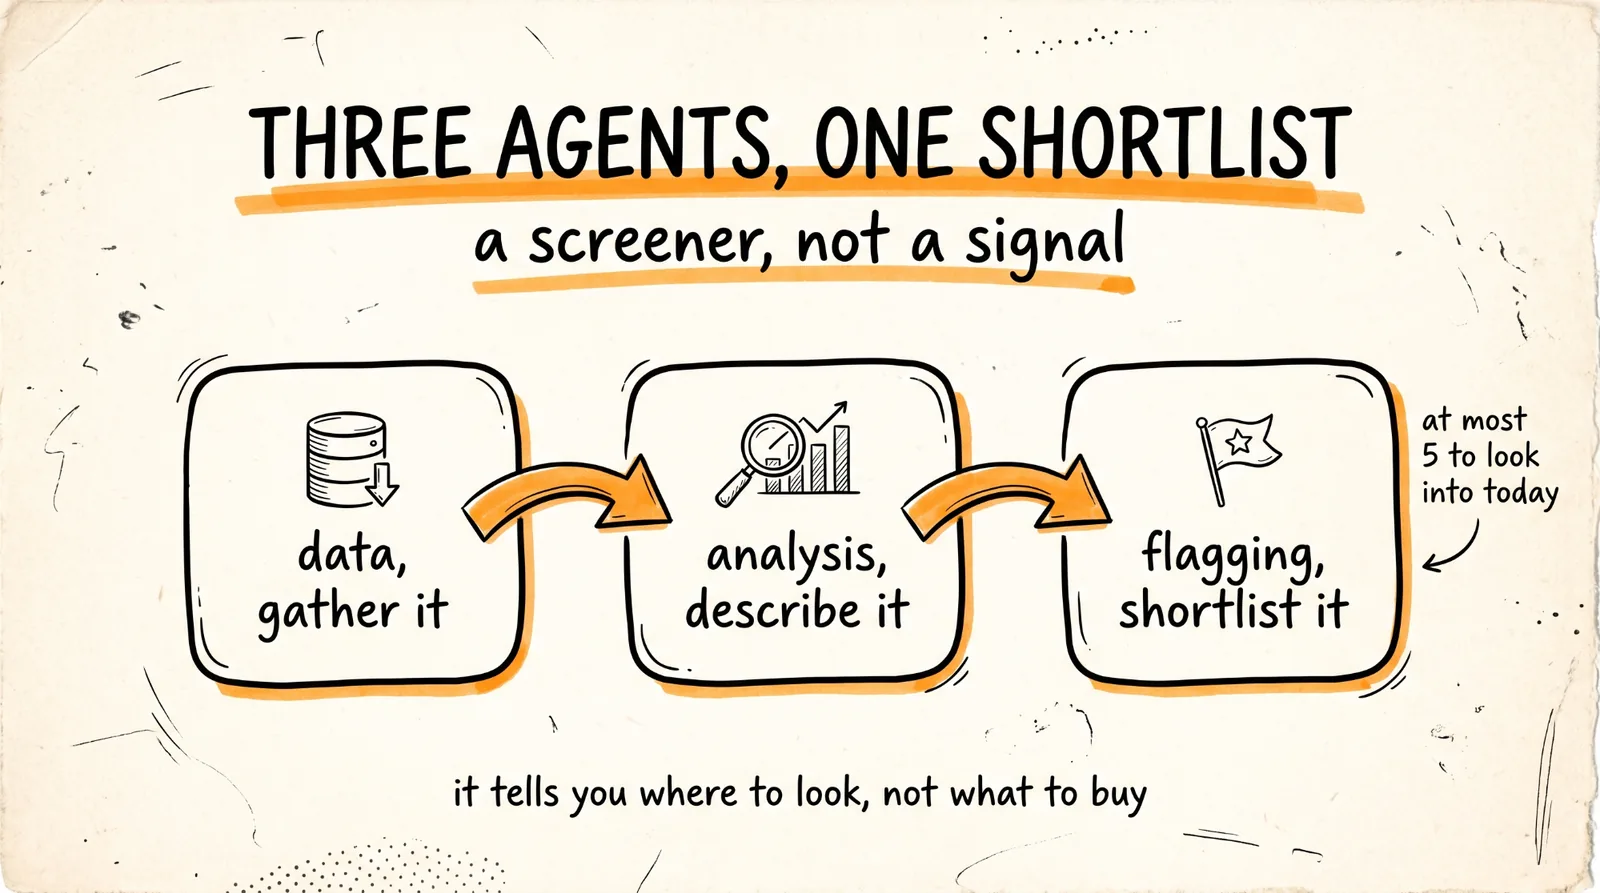
You are going to build a three-agent system: one that pulls price history and options data across a universe of stocks, one that analyzes the relationship between them, and one that flags where they disagree so you have somewhere to point your attention.
Don't want to figure this out alone? I walk members through every step inside the community. Join the Skool → skool.com/raycfu
Step 1: The Data Agent
The first agent gathers. Its only job is pulling clean, dated, sourced data, because everything downstream inherits whatever mistakes happen here.
You are my market data agent. Your only job is gathering data. You never analyze it and you never make recommendations.
For each ticker in my watchlist, pull and record:
- Daily price history for the last 90 days, plus current price and volume
- Volume relative to its own 30-day average
- Today's total options volume, split into calls and puts
- The change in open interest for the most active strikes, not just the volume
- Any earnings date, dividend date, or scheduled event in the next 30 days
Rules: record the source and timestamp for every figure. If a data point is unavailable, write UNAVAILABLE rather than estimating or carrying forward yesterday's number. Never fill a gap. Save everything to a dated file so I can compare across days.
That instruction about open interest, not just volume, is the single most important line in this whole guide, and the next section explains why.
For data sources, options chains and volume are available free from public sources including exchange sites and standard finance APIs. Free data is usually delayed rather than real-time, which is fine for this use and worth knowing before you build a system that assumes it is live.
Step 2: The Analysis Agent
The second agent looks for the gap: places where the options activity and the price action are telling different stories.
You are my analysis agent. You read the data file and describe what you see. You never recommend a trade.
For each ticker, report:
- Where today's options volume sits relative to its own normal range
- The call to put ratio today versus its 30-day average
- Whether open interest actually increased at the active strikes, which means new positions were opened, or decreased, which means existing positions were closed
- Whether price action confirms or contradicts what the options activity suggests
- Whether there is a scheduled event that would explain the activity
Then flag any ticker where unusual options volume opened new positions and the price has not moved correspondingly.
For every flag, state plainly what you cannot determine from this data: whether the volume was buying or selling, whether it was opening or closing for the counterparty, and whether it is directional or a hedge. Never describe activity as bullish or bearish, describe it as activity.
Rank flags by how unusual the volume is relative to that specific ticker's own history, not by absolute size, because a big number on a big stock is normal.
That last instruction on describing rather than interpreting is what keeps this tool honest. A model asked what unusual call volume means will produce a confident bullish story every time, because that is the story in the training data.
Step 3: What Options Volume Actually Tells You
This is the section that decides whether this system makes you money or costs it, and it is the part that every video about options flow leaves out.
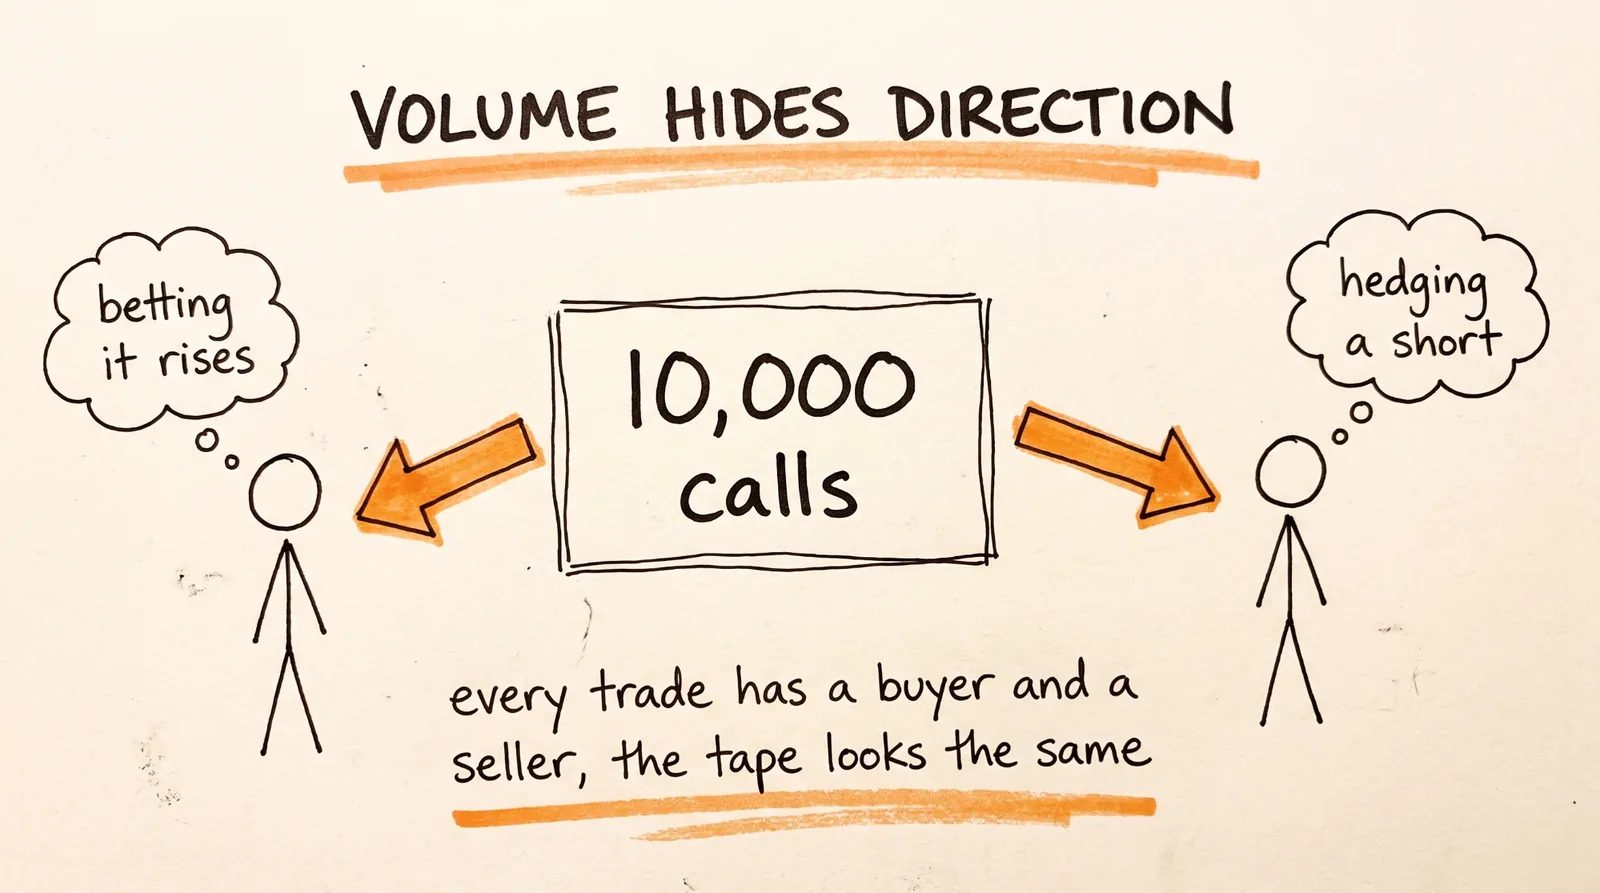
Raw volume does not tell you direction. Every options contract has a buyer and a seller. A trade printing 10,000 calls does not tell you whether someone bought 10,000 calls expecting a rally or sold 10,000 calls collecting premium and expecting the opposite. The volume is identical either way. Without knowing whether the trade hit the bid or the ask, and often not even then, direction is an assumption you are adding, not information you received.
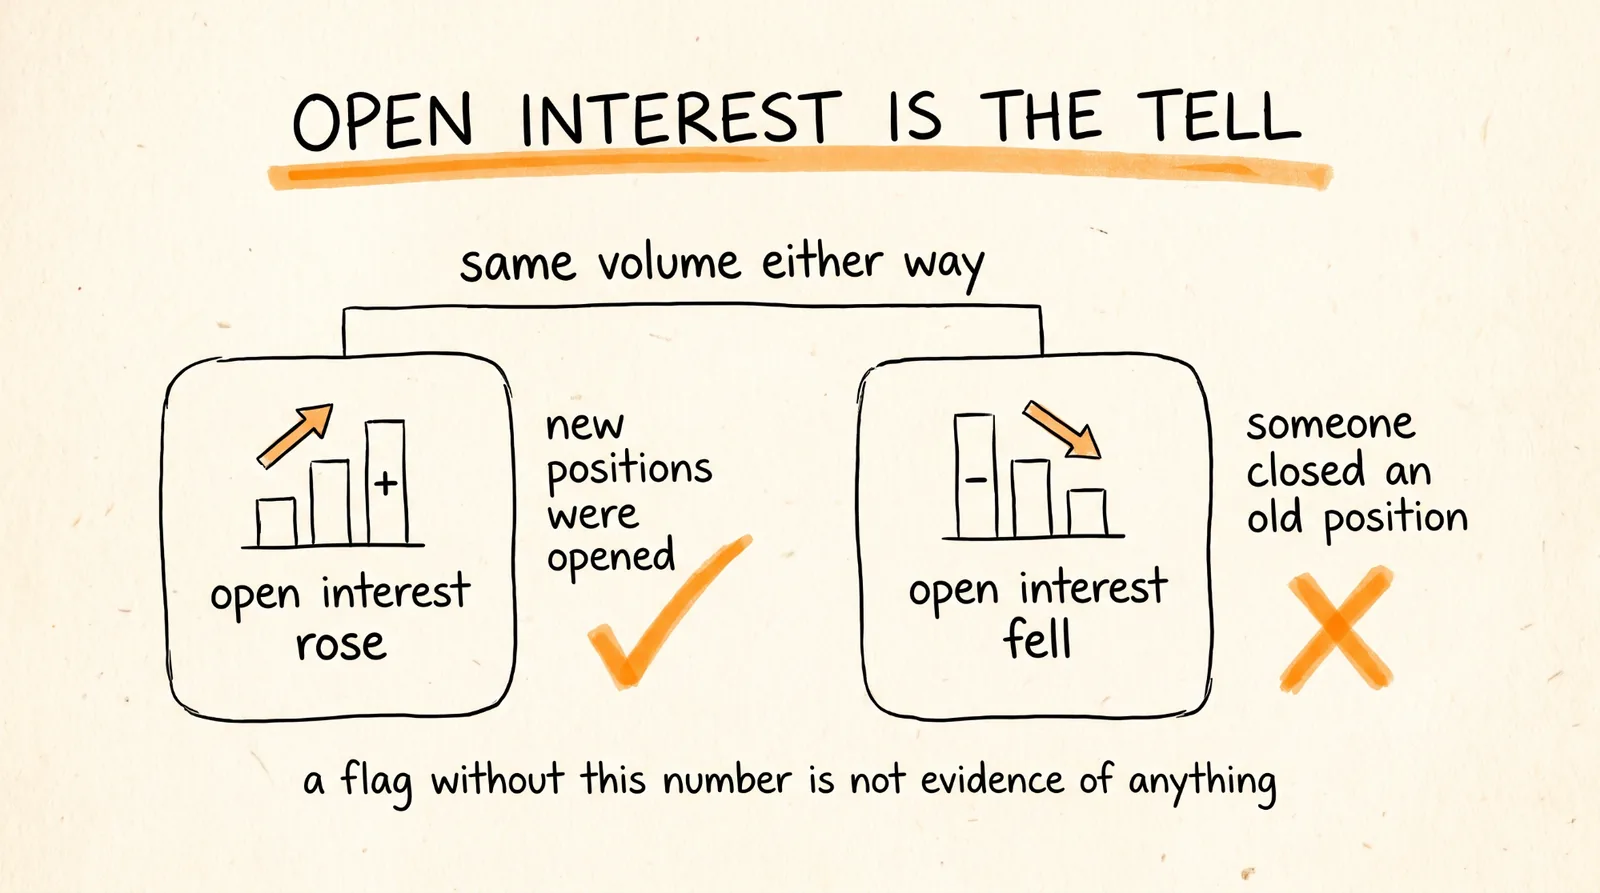
Volume does not tell you whether positions opened or closed. Ten thousand contracts trading could be ten thousand new bets or someone exiting a position they took last month. The only thing that distinguishes them is the change in open interest, which updates after the session. This is why the data agent pulls it and why a flag without it is not evidence of anything.
Much institutional options activity is not a bet at all. Institutions hedge. A fund holding a large equity position buys puts to protect it. A desk that sold you calls buys stock to stay neutral. A big block of calls can be a hedge on a short position, in which case the "bullish signal" is attached to somebody who is actually bearish. You cannot tell these apart from the outside.
And "smart money" is a marketing frame. Institutional filings that do reveal real positions, like 13Fs, are published with a delay of roughly 45 days, so by the time you can see what a fund held, they may have exited. There is no public feed of what informed money is doing right now, and services selling one are selling an inference, not a fact.
None of this makes the system useless. It makes it a screener rather than a signal. Unusual activity is a legitimate reason to go look at a company. It is not a reason to take a position, and the difference between those two sentences is most of the money people lose in this corner of the market.
Step 4: The Flagging Agent, Not the Trade Agent
Which is why the third agent flags candidates rather than making calls.
You are my flagging agent. You produce a research shortlist. You never recommend entries, exits, position sizes, or trades.
Read the analysis output and give me at most 5 tickers worth looking into today. For each one:
- What specifically is unusual, with the numbers
- Whether open interest confirms new positions were opened
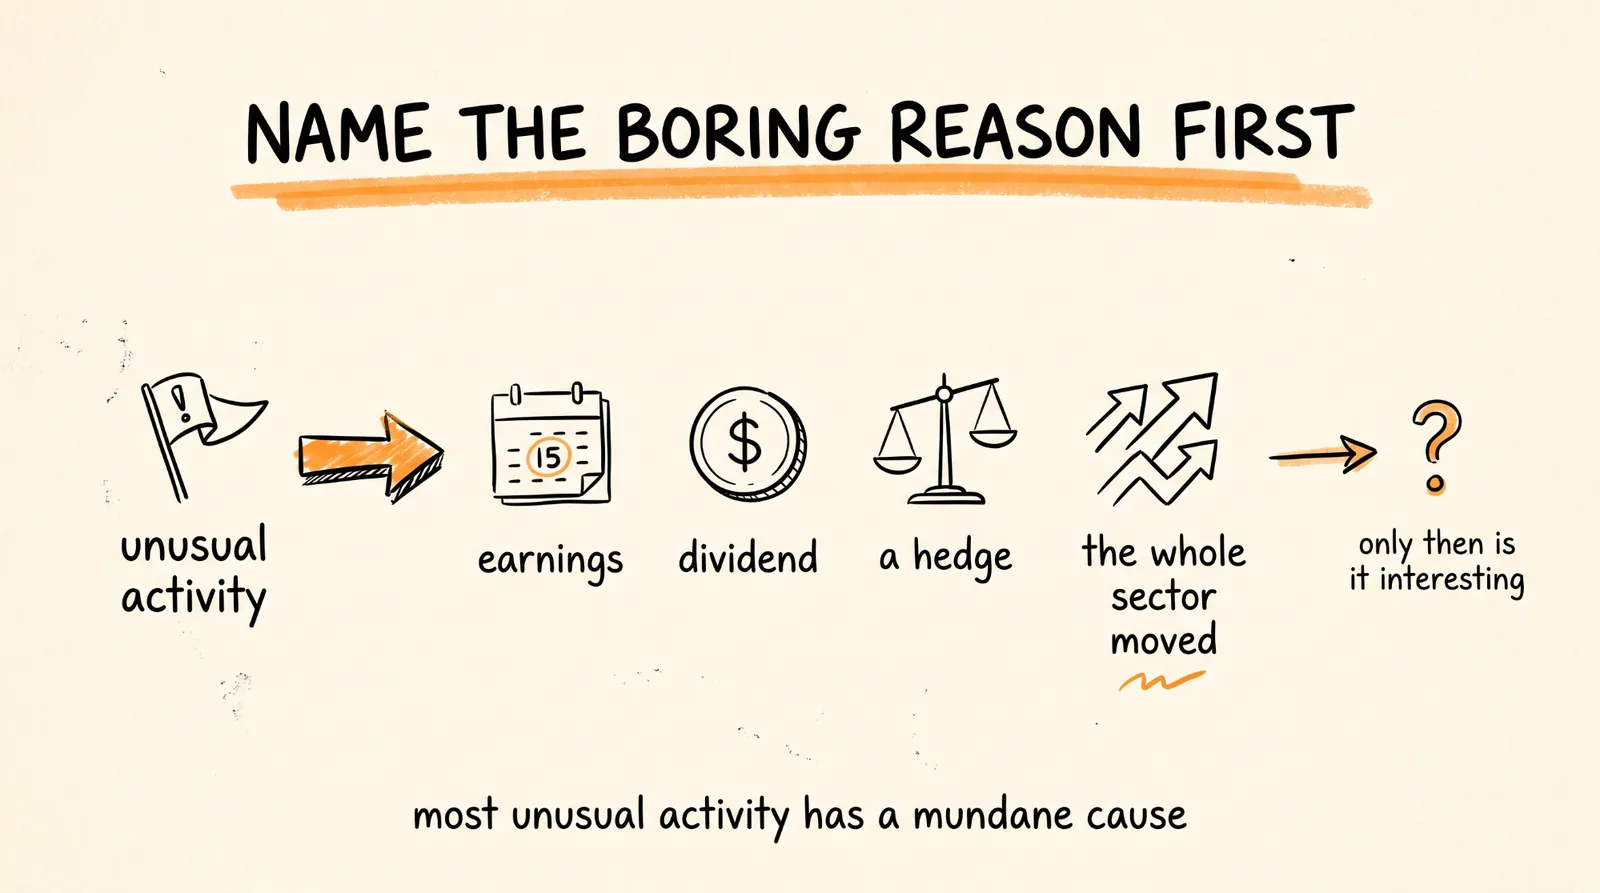
- What the most likely boring explanation is: earnings, a dividend, an index rebalance, a known hedge, sector-wide movement
- What I would need to find out to know whether this matters
- A confidence level, and say low when it is low
If nothing is genuinely unusual today, say so in one line. Do not produce five flags because I asked for five.
Then end with the single question I should research first.
The boring-explanation requirement is doing real work there. Most unusual activity has a mundane cause, and an agent forced to name it before flagging anything will kill a lot of false excitement before it reaches you.
How to Use This Without Losing Money
Treat every flag as the start of research, not the end. The output is "go look at this," and what you do next is read the filings, the news, and the earnings calendar yourself.
Track your flags. Log every one, and note what actually happened over the following two weeks. After three months you will know your real hit rate rather than remembering the flags that worked. Most people who run these systems have never done this, which is why they still believe it works.
Watch out for the confident narrative. When the agent describes activity, that is data. If it starts explaining why institutions are positioning for a move, it is writing fiction that sounds like analysis, and that is the exact output that gets people to trade.
Verify at the source before acting on anything. Options data from free feeds is delayed and sometimes wrong, and a decision made on a bad number is worse than no decision.
And be honest about the instrument. Options are leveraged and they expire, which means being right about direction and wrong about timing still loses everything. That is a very different risk profile from owning shares, and it is why this section exists.
What This Is
A genuinely useful attention-direction system. Thousands of tickers, a handful worth looking at today, sorted by how unusual their activity is relative to their own history. That saves real hours and surfaces things you would never have found scrolling.
It is not a window into what informed money is doing, because that window does not exist publicly. It is a way of noticing when something is different, which is where research starts and not where it ends.
The Recap
Build a data agent that pulls price, volume, options volume, and critically the change in open interest, with a source and timestamp on every figure and UNAVAILABLE where data is missing. Build an analysis agent that describes the gap between options activity and price movement without interpreting it as bullish or bearish. Build a flagging agent that gives you at most 5 research candidates a day, names the boring explanation for each, and says when nothing is unusual.
Then remember what volume does and does not tell you, log every flag, and check your real hit rate after three months.
Don't want to figure this out alone? I walk members through every step inside the community. Join the Skool → skool.com/raycfu
IMPORTANT: This guide is for educational purposes only. Nothing here is financial advice. Options are a leveraged instrument and you can lose more than you put in. The system below is a research and screening tool, not a signal generator, and the section on what options volume actually tells you is the most important part of this guide. Never trade money you cannot afford to lose.