
How to actually use Graph Engineering in your AI workflow
By the end of this you will know what a graph is, how to spot one hiding in the workflow you already run, the one pattern that makes graphs worth using, where they quietly fail, and how to actually run one in Claude Code so the parallel parts really do run in parallel.
Don't want to figure this out alone? I walk members through every step inside the community. Join the Skool → skool.com/raycfu
What a Graph Actually Is
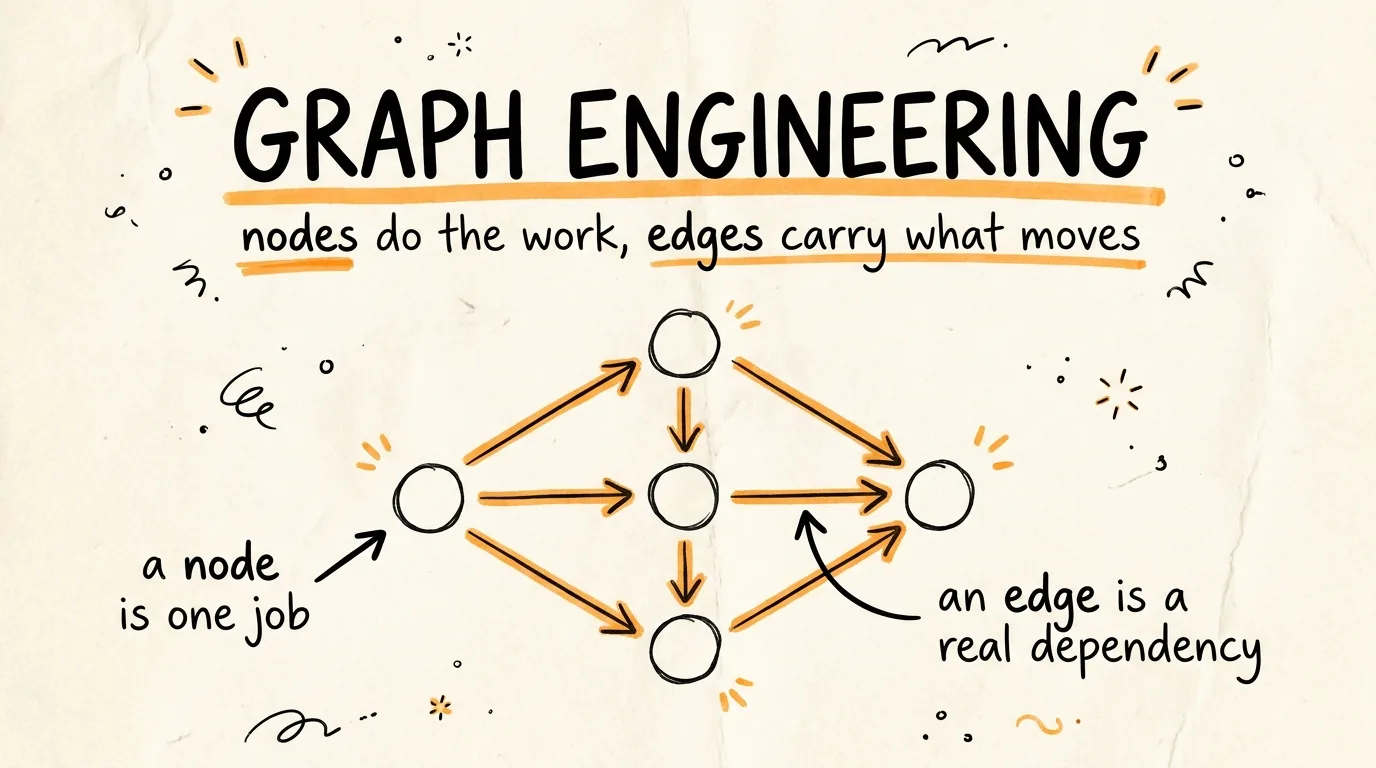
Forget charts with bars and lines. A graph here is just a map of which jobs need to happen and what each one depends on. Two pieces, that is the whole thing.
A node is one unit of work. One job, one thing in, one thing out. Not "research this topic and write a summary and check the sources." Just one of those. The smaller and more defined the job, the more useful the node.
An edge is a dependency. It connects two nodes only when the second one genuinely needs what the first one produced. Not "these happen in order." Only when the output of one actually feeds the input of the other.
Nodes do the work. Edges carry what moves between them. Everything else in graph engineering is those two ideas at different sizes.
Your Workflow Is Already a Graph
Here is what most people miss: you are already building graphs, just bad ones.
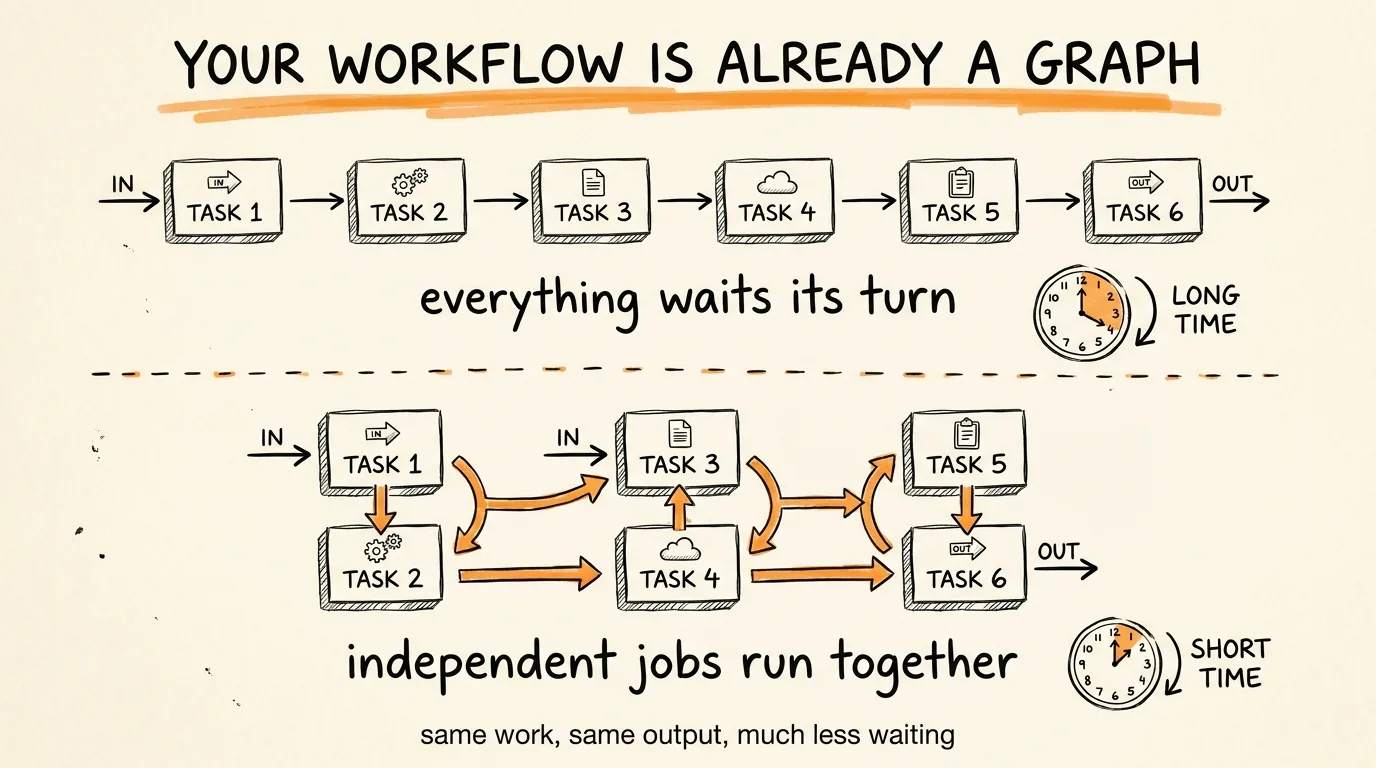
When you write "research this topic, then summarize what you find, then write a draft from the summary," that is a graph. It is one unbranching chain where every step waits for the one before it. It runs correctly, and it runs slowly, and it breaks easily, because a chain has no redundancy. If the summary comes out unusable, the draft fails. If the research is slow, everything behind it waits.
So the first move in graph engineering is not learning something new. It is looking at what you already run and asking whether every step actually needs to wait.
The linear version: research, then summarize, then write, then check sources, then format, then publish. Six steps in a line, and the total time is the sum of all six.
Redrawn as a graph: research and check sources at the same time, then summarize, then write and format at the same time, then publish. Same work, same output, less waiting, because independent jobs stopped queuing behind each other.
The Fake-Edge Test
Once you can see your workflow as a graph, go find the edges that should not be there. This takes five minutes on any workflow.
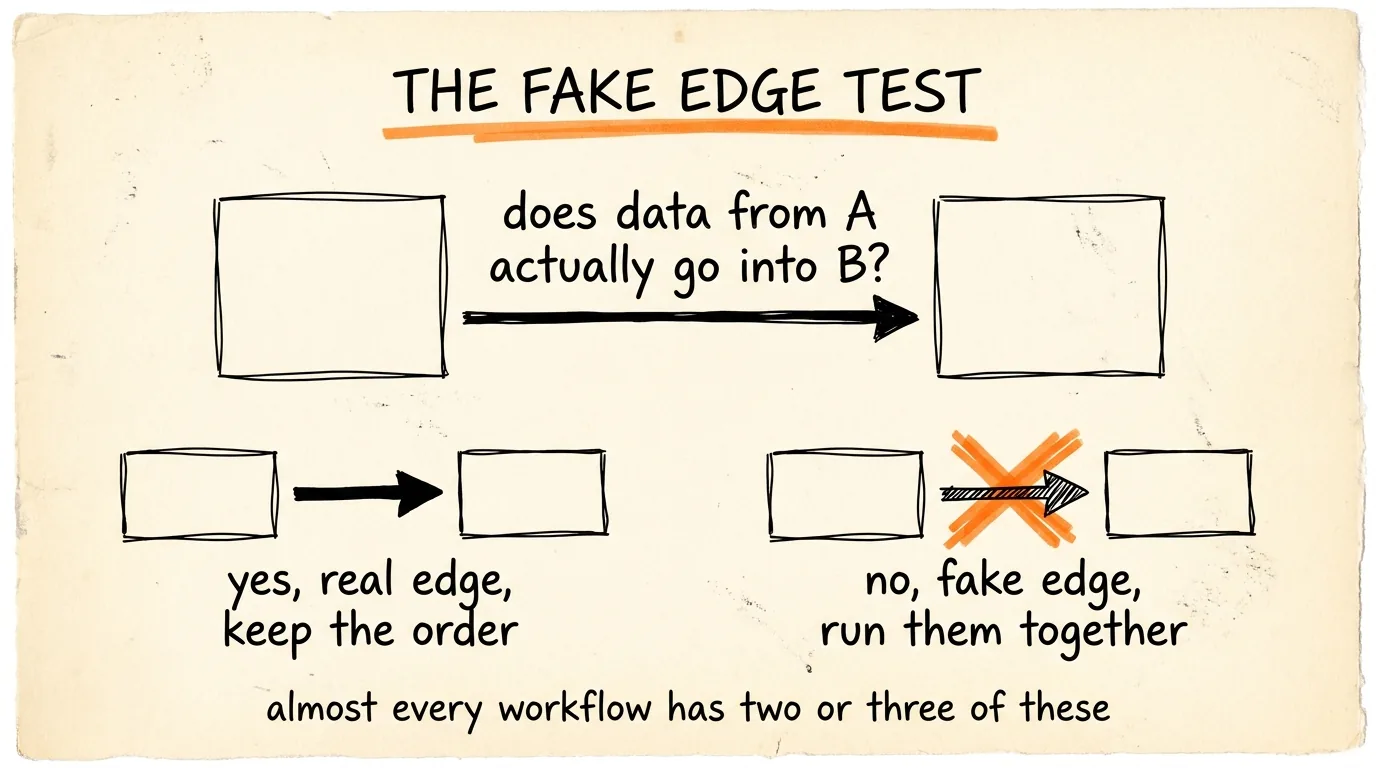
Write out every step as a box. Draw an arrow between each pair of consecutive steps. Then at every single arrow, ask one question: does data from the first step actually go into the second one?
If yes, the edge is real, keep it. If no, delete the arrow, that is a fake edge and the wait it creates is pure waste.
The classic example: "review file A for bugs, then review file B for bugs." It reads like a sequence. But the review of B never looks at what A returned. They only run in order because that is the order you typed them. Run them together and the whole thing takes as long as the slower one instead of both added up.
When you finish, anything with no incoming arrow can start immediately, and anything with no outgoing arrow is a final output. You will find two or three fake edges in almost any workflow you draw, and every one of them is time you were giving away.
The Diamond
Once you start deleting fake edges, one shape shows up more than any other, and it is the shape that makes graphs worth the effort.
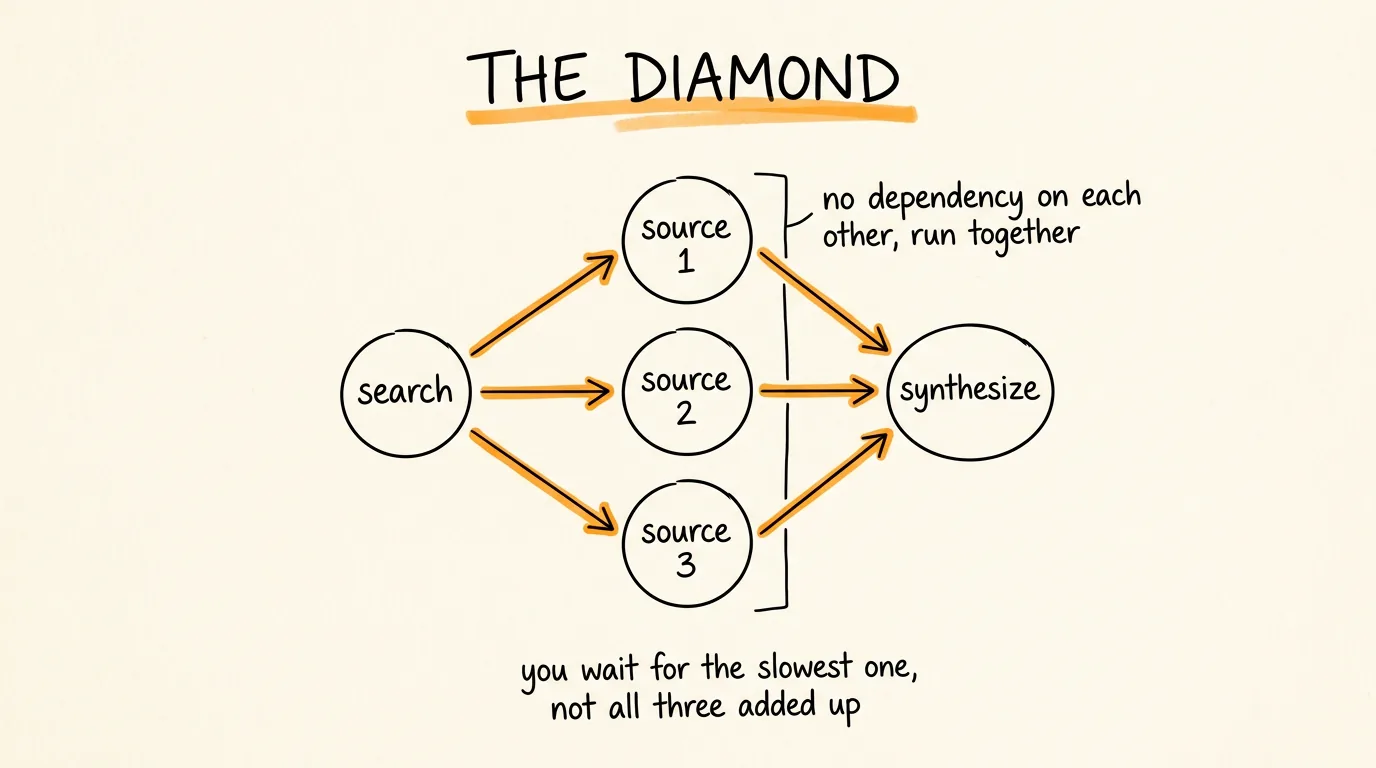
One node fans out into several parallel nodes, and those all feed into one final node that pulls the outputs together. Drawn out, it looks like a diamond.
The linear version of research looks like: search, read source 1, read source 2, read source 3, synthesize. The diamond version: search, then read all three sources at the same time, then synthesize.
The synthesis node gets identical inputs either way. But it waits for the slowest source read instead of all three added together.
The pattern has two rules and both matter. The parallel nodes must be genuinely independent, no fake edges disguised as real ones. And the convergence node must actually need all of them, because if it only needs one, the others were wasted work.
Once you know this shape you see it everywhere. Research pipelines, code review, market analysis, competitive teardowns. Anytime the work is "gather from several places, then combine," you have a diamond. The gathering is parallel. The combining is the one wait you cannot avoid.
Where Graphs Quietly Fail
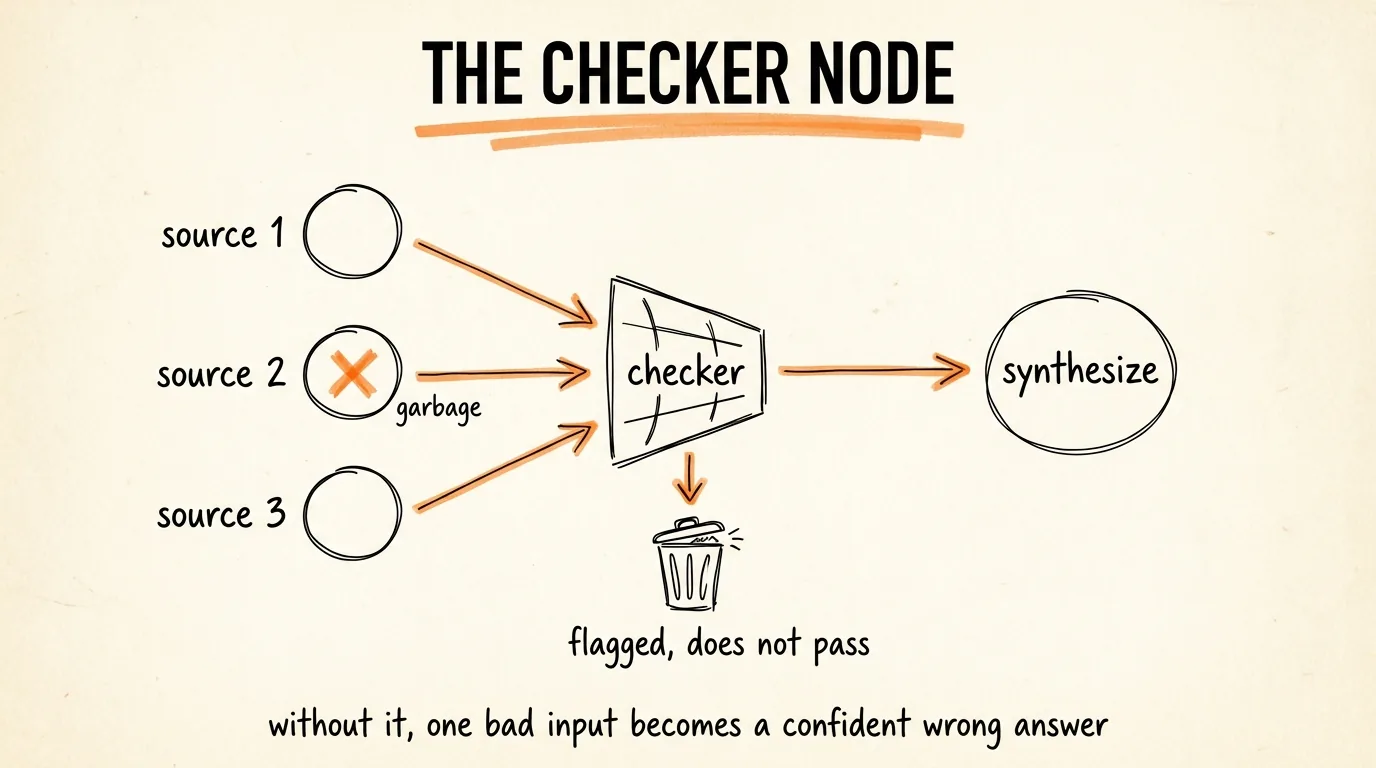
The diamond is clean in theory. In practice it breaks in two specific places and both are easy to miss.
The first is a bad node going undetected. Three sources run in parallel and one returns garbage, a hallucination, an empty result, a misread file. That bad output flows straight into your synthesis node next to the two good ones, and the synthesis node has no idea one of its inputs is wrong. It combines everything and gives you a confident answer built on bad material. The parallel structure that made it fast also deleted the checkpoints where you would have caught the problem.
The second is a cascade. In a straight line, a bad step produces a visibly bad output and you see it right away. In a graph, the bad output gets blended with good ones and the error becomes hard to trace. By the time the final node answers, the damage is diluted and invisible.
Both have the same fix: a checker node.
A checker sits between your parallel layer and your convergence point. Its only job is judging each output before it moves forward. It does not synthesize, it does not write, it does not do any of the real work. It asks whether each output is usable, and passes it, flags it, retries it, or drops it.
Five things every checker node should catch: outputs that came back empty or null, outputs that contradict each other in ways that cannot both be true, outputs that are off topic relative to the original task, confidence signals too low to rely on, and format errors that will break the synthesis node when it tries to parse them.
A graph without a checker is a graph that assumes everything upstream worked. That assumption fails more often than you would expect.
How to Actually Run This in Claude Code
Here is the part where most posts about graphs get vague, and where a detail actually matters.
Claude Code is conservative about parallelism by default. If you describe a set of tasks, it will often just work through them in order. Structure alone does not make things run at the same time. You have to explicitly ask for subagents, and being concrete about the number works better than saying "parallelize this."
So a graph prompt has two parts: the structure, which tells Claude what depends on what, and the instruction to fan out, which is what actually makes it parallel.
Here is the format. Paste it into Claude Code and change what is in brackets:
Run this as a graph. Use separate subagents for the independent nodes and run them at the same time, then run the dependent nodes in dependency order. Each subagent returns a summary, not a full dump.
NODES
research_a
task: Research [Company A]. Cover pricing, core features, recent product changes, and public sentiment. Output a structured summary.
depends on: nothing
output: company_a.md
research_b
task: Research [Company B]. Same coverage and format.
depends on: nothing
output: company_b.md
research_c
task: Research [Company C]. Same coverage and format.
depends on: nothing
output: company_c.md
checker
task: Read all three research files. Flag any that are empty, off topic, internally contradictory, or missing a required section. Do not fix them, report only.
depends on: research_a, research_b, research_c
output: checker.md
synthesize
task: Using the three research files and checker.md, write a comparison table across pricing, features, and positioning, plus a one paragraph positioning summary for each company. Exclude anything the checker flagged.
depends on: checker
output: comparison.md
Start by running research_a, research_b, and research_c in three parallel subagents.
Three things to notice, because they are the whole design. The three research nodes depend on nothing, so they start together. The checker depends on all three, so it waits for every one of them. And synthesize depends only on the checker, not on the research nodes directly, which makes the checker a gate that bad output cannot go around.
Two practical limits worth knowing. Subagents run up to about 10 concurrent tasks, and anything beyond that queues, so keep your parallel layer under ten. And every subagent's summary comes back into your main context, which means a wide fan-out of long reports can fill up the window you were trying to protect. That is why the prompt says summary, not full dump.
One more option for bigger jobs: Claude Code also has a native Workflows feature, where Claude writes an orchestration script that fans work out across many subagents and you can rerun it. That is the heavier tool for codebase audits, large migrations, and cross-checked research. Start with the prompt format above, and reach for native workflows when you outgrow it. Just know that multi-agent runs burn through usage limits noticeably faster than a single session.
Two More Graphs to Steal
Multi-file code review. Same shape, different work:
Run this as a graph, using separate subagents for the independent nodes.
review_auth: Review auth.py for security issues, edge cases, and code quality. Be specific. Depends on nothing.
review_api: Review api.py, same criteria. Depends on nothing.
review_db: Review db.py, same criteria. Depends on nothing.
checker: Read all three reviews. Flag any issue that appears in more than one file, and note cross-file dependencies that could cause problems. Depends on all three reviews.
summary: Using all reviews and the checker report, write a prioritized fix list, critical first, then medium, then low. Depends on checker.
Start the three reviews in parallel subagents now.
Article research and draft:
Run this as a graph, using separate subagents for the independent nodes.
angle_a: Research [topic] from the perspective of [audience A]. What do they care about most, and what do they get wrong about it? Depends on nothing.
angle_b: Same, for [audience B]. Depends on nothing.
examples: Find 3 specific real world examples of [topic] most people have not heard of. No generic case studies. Depends on nothing.
checker: Review all three. Flag anything thin, off topic, or unverifiable. Report only. Depends on angle_a, angle_b, examples.
draft: Write a draft that speaks to both audiences and opens with one of the specific examples, excluding anything flagged. Depends on checker.
Start angle_a, angle_b, and examples in parallel subagents now.
Replace the brackets and the structure holds for anything.
Static Graphs vs Dynamic Graphs
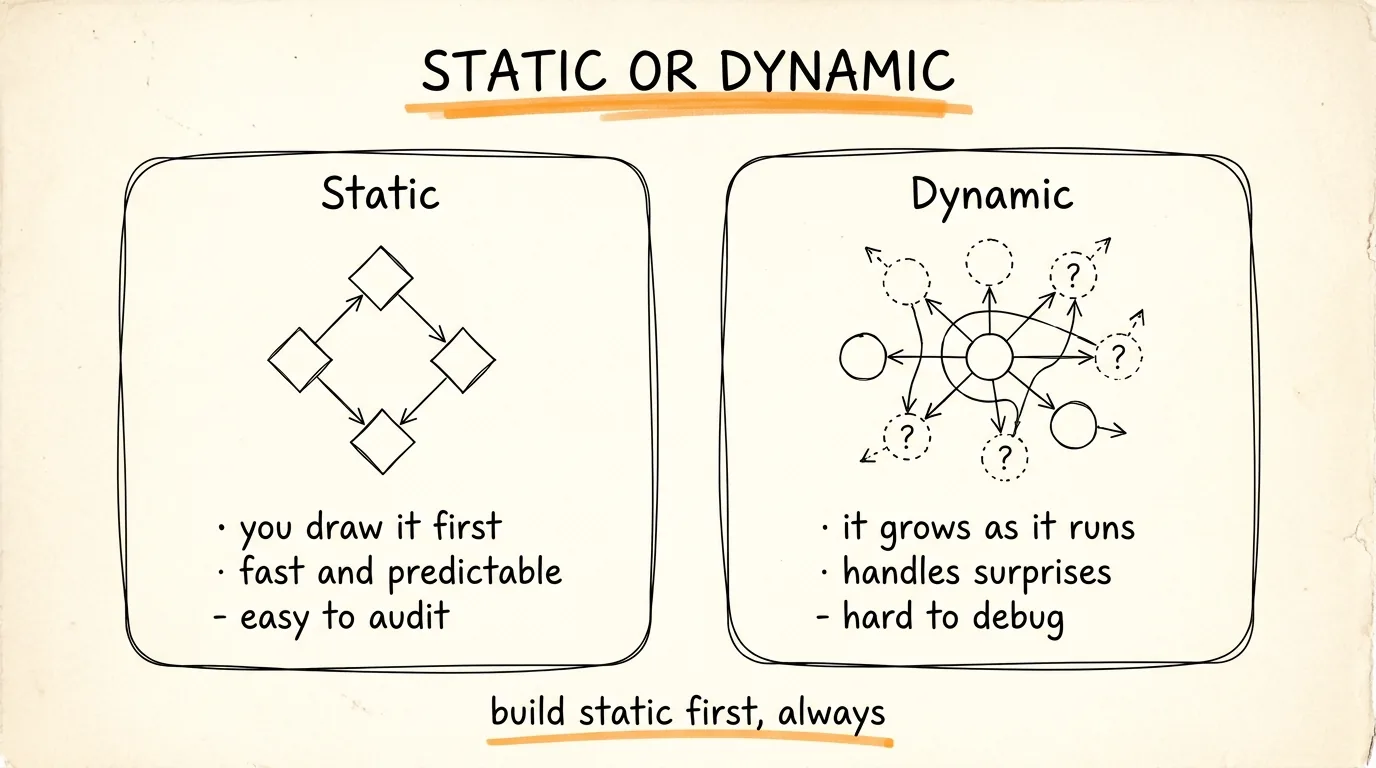
Everything so far assumes you know the shape before you start. You define the nodes, draw the edges, run it. That works for repeatable work where the structure is the same every time.
But sometimes the shape only becomes clear as you go. You start researching and find one source needs three more lookups. You start a review and one file turns out to need far deeper analysis. In a dynamic graph, the structure builds itself as it runs, a node finishes, looks at what it found, and decides what should come next.
Static is fast and predictable, you know exactly what will run and roughly how long it takes. Dynamic is flexible and handles surprises, but it is much harder to debug, because the graph that ran is not the one you drew.
The rules that save you backtracking. Use static when the task repeats and the structure is the same every time, and when speed and predictability matter more than flexibility. Use dynamic when the scope genuinely depends on what you find along the way. Always build the static version first and switch only when you hit a wall it cannot handle. And never use a dynamic graph for anything where you need to audit exactly what ran and why.
Most workflows that feel like they need a dynamic graph just need a better static one.
When a Graph Is the Wrong Choice
Graphs cost more to set up and more to debug than a straight line, and they are not free to run, because parallel subagents multiply token use. So skip the graph when the task is a one-off you will never repeat, when the steps genuinely do depend on each other in a line, when the whole job finishes in a couple of minutes anyway, or when you need to watch every step closely.
Graphs are worth it when the task repeats, when it is big enough that the time savings compound, or when a mistake in the middle is expensive enough that the checker node pays for itself.
Set Your Defaults Once
For any project where you run graphs more than twice, put your rules in CLAUDE.md so you stop rebuilding that context every session:
## Workflow defaults
- When I describe a graph, run nodes with no dependencies as parallel subagents, and say how many you are spawning before you start.
- Keep parallel layers to 10 nodes or fewer.
- Every subagent returns a summary, not its full working.
- Checker nodes flag problems, they never fix them and never silently pass something through.
- Never merge output from a flagged node into a final synthesis.
- If a node fails, stop and report before continuing.
- Output files go to /outputs named after the node.
One file, set once, and every graph in that project inherits it.
What Changes When You Think in Graphs
The prompts above are useful today, but the real shift shows up after a few weeks. You stop reading a task as a list of things to do and start reading it as a set of dependencies. The first question stops being "what do I do first" and becomes "what actually has to wait for what," and the answer is almost always less than you assumed.
It changes how you write prompts too. A linear prompt tells Claude what to do in order. A graph prompt tells Claude what each piece needs and lets it work out the order. That is a shorter prompt, easier to edit, and it does not break when you swap one node out.
Don't want to figure this out alone? I walk members through every step inside the community. Join the Skool → skool.com/raycfu